9 Little-Known KPIs for Managing Your Supply Chain in Real Time
20 January 2026


20 January 2026
In a highly volatile environment, traditional supply chain KPIs are no longer sufficient to drive performance. This article presents nine little-known KPIs that are essential for moving towards real-time, proactive and resilient management: probabilistic forecasting, omnichannel availability, dynamic replenishment, silent stockouts, data latency, supplier resilience, and more. Concrete indicators to better anticipate, react faster and transform supply chain data into operational actions.
Sustained inflation, increased demand volatility, supply constraints, rapid and sometimes unpredictable increases in customs duties linked to geopolitical contexts, and the rise of omnichannel retail (stores, e-commerce, marketplaces, B2B, etc.): the supply chain has become a living system, subject to constant pressure.
In this context, traditional supply chain KPIs – service rate, stock level, OTIF, turnover, coverage – remain essential. But they have one major limitation: they mainly analyse the past. They rarely explain where, why and when performance is declining, let alone how to anticipate it.
The most successful companies therefore supplement their dashboards with advanced indicators, focused on:
Anticipation (forecasts, risks of disruption, uncertainty),
Operational responsiveness (real time, replenishment, workflows),
Resilience and sustainability (suppliers, energy, process robustness).
In this article, discover 9 supply chain KPIs that are still underused but have strong operational and business leverage to move from retrospective management to real-time, proactive and resilient management.
Probabilistic forecasting no longer seeks a single 'correct' forecast, but measures the probability that actual demand will fall within a given range.
Example:
An 80% probability that demand will be between 950 and 1,050 units.
We therefore reason in terms of statistical scenarios (P50, P80, P95) rather than a single value.
Sizing of safety stocks based on actual risk.
Alignment between service level targets and level of uncertainty.
Essential basis for quantile AI forecasts.
–20 to –40 per cent overstocking on well-modelled families.
–10 to –25 per cent fewer breakdowns at constant service levels.
Multi-channel availability measures the ability to make a product truly saleable, simultaneously, across all channels: shop, e-commerce, marketplace, B2B, drive.
Elimination of phantom stockouts (stock exists but is unavailable for sale).
Consistent customer experience, regardless of the channel.
Real-time synchronisation between ERP, WMS, OMS, e-commerce and marketplaces.
Percentage of items in stock but not saleable on at least one channel.
Stock discrepancies between systems.
Average time taken to update availability after an actual movement.
This KPI assesses the system's ability to automatically adjust replenishment parameters (quantities, frequencies, thresholds) based on:
of actual demand,
seasonality,
external events (promotions, weather, marketing campaigns).
It is part of a logic of demand sensing and AI-driven replenishment.
Faster response than manual settings.
Reduction in the time between market signals and operational action.
Time lag between change in demand and adjustment of replenishment.
Percentage of automatic versus manual replenishments.
Changes in shortages and average stocks.
Silent stockouts include all situations where a product is not sold without being declared out of stock:
blocked stock (quality, picking, system status),
incorrect restocking thresholds,
unpublished or unexhibited item,
desynchronisation between physical and digital.
Lost sales do not appear in traditional reports.
It reveals a hidden source of revenue.
Sessions or visits without the possibility of purchase.
Orders not fulfilled despite sufficient theoretical stock.
Comparison of conversion rates before and after correction.
This KPI measures the speed of change in operational processes: reception, preparation, restocking, returns, quality control.
Ability to adapt flows without heavy IT projects.
Promotion of no-code/low-code platforms.
Average time to modify a workflow.
Number of workflows created or adjusted per month.
Percentage of processes managed via configurable tools.
Ratio between energy consumption and a logistics unit: order, parcel, pallet, tonne transported.
Economic/environmental performance crossover.
Assistance in choosing between logistics schemes.
Direct contribution to CSR and Scope 3 objectives.
kWh per order prepared.
Litres of fuel per 100 kilometres per tonne.
CO₂ emissions per order line.
Time lag between the generation of data (sale, receipt, stock movement) and its actual use by decision-making systems.
High latency renders decisions obsolete.
In omnichannel, it generates customer promise errors.
< 5 minutes: near real time (ideal).
5–15 minutes : acceptable.
≥ 1 hour: risk zone.
Percentage of supply chain processes that have been optimised, digitised or automated over a given period.
Clear vision of digital maturity.
Transition from POC to industrialisation.
Percentage of critical processes digitised.
Percentage of manual tasks automated.
Number of new use cases deployed.
Ability of strategic suppliers to maintain service in the event of disruption: shortages, crises, peaks in demand, exchange rate fluctuations.
Identification of dependency risks.
Management of contingency plans (multi-sourcing, buffer stocks).
Variability of lead times.
Service levels during times of crisis.
Scalability.
Level of supplier dependency.
These nine supply chain KPIs do not replace traditional indicators. They complement them by reinforcing:
anticipation (probabilistic forecasts, silent disruptions),
Real-time execution (dynamic reapproach, workflows, data latency, omnichannel),
Sustainability and resilience (energy, suppliers, process innovation).
By gradually integrating them into your dashboards, you can transform your supply chain into a real-time, agile and resilient system.
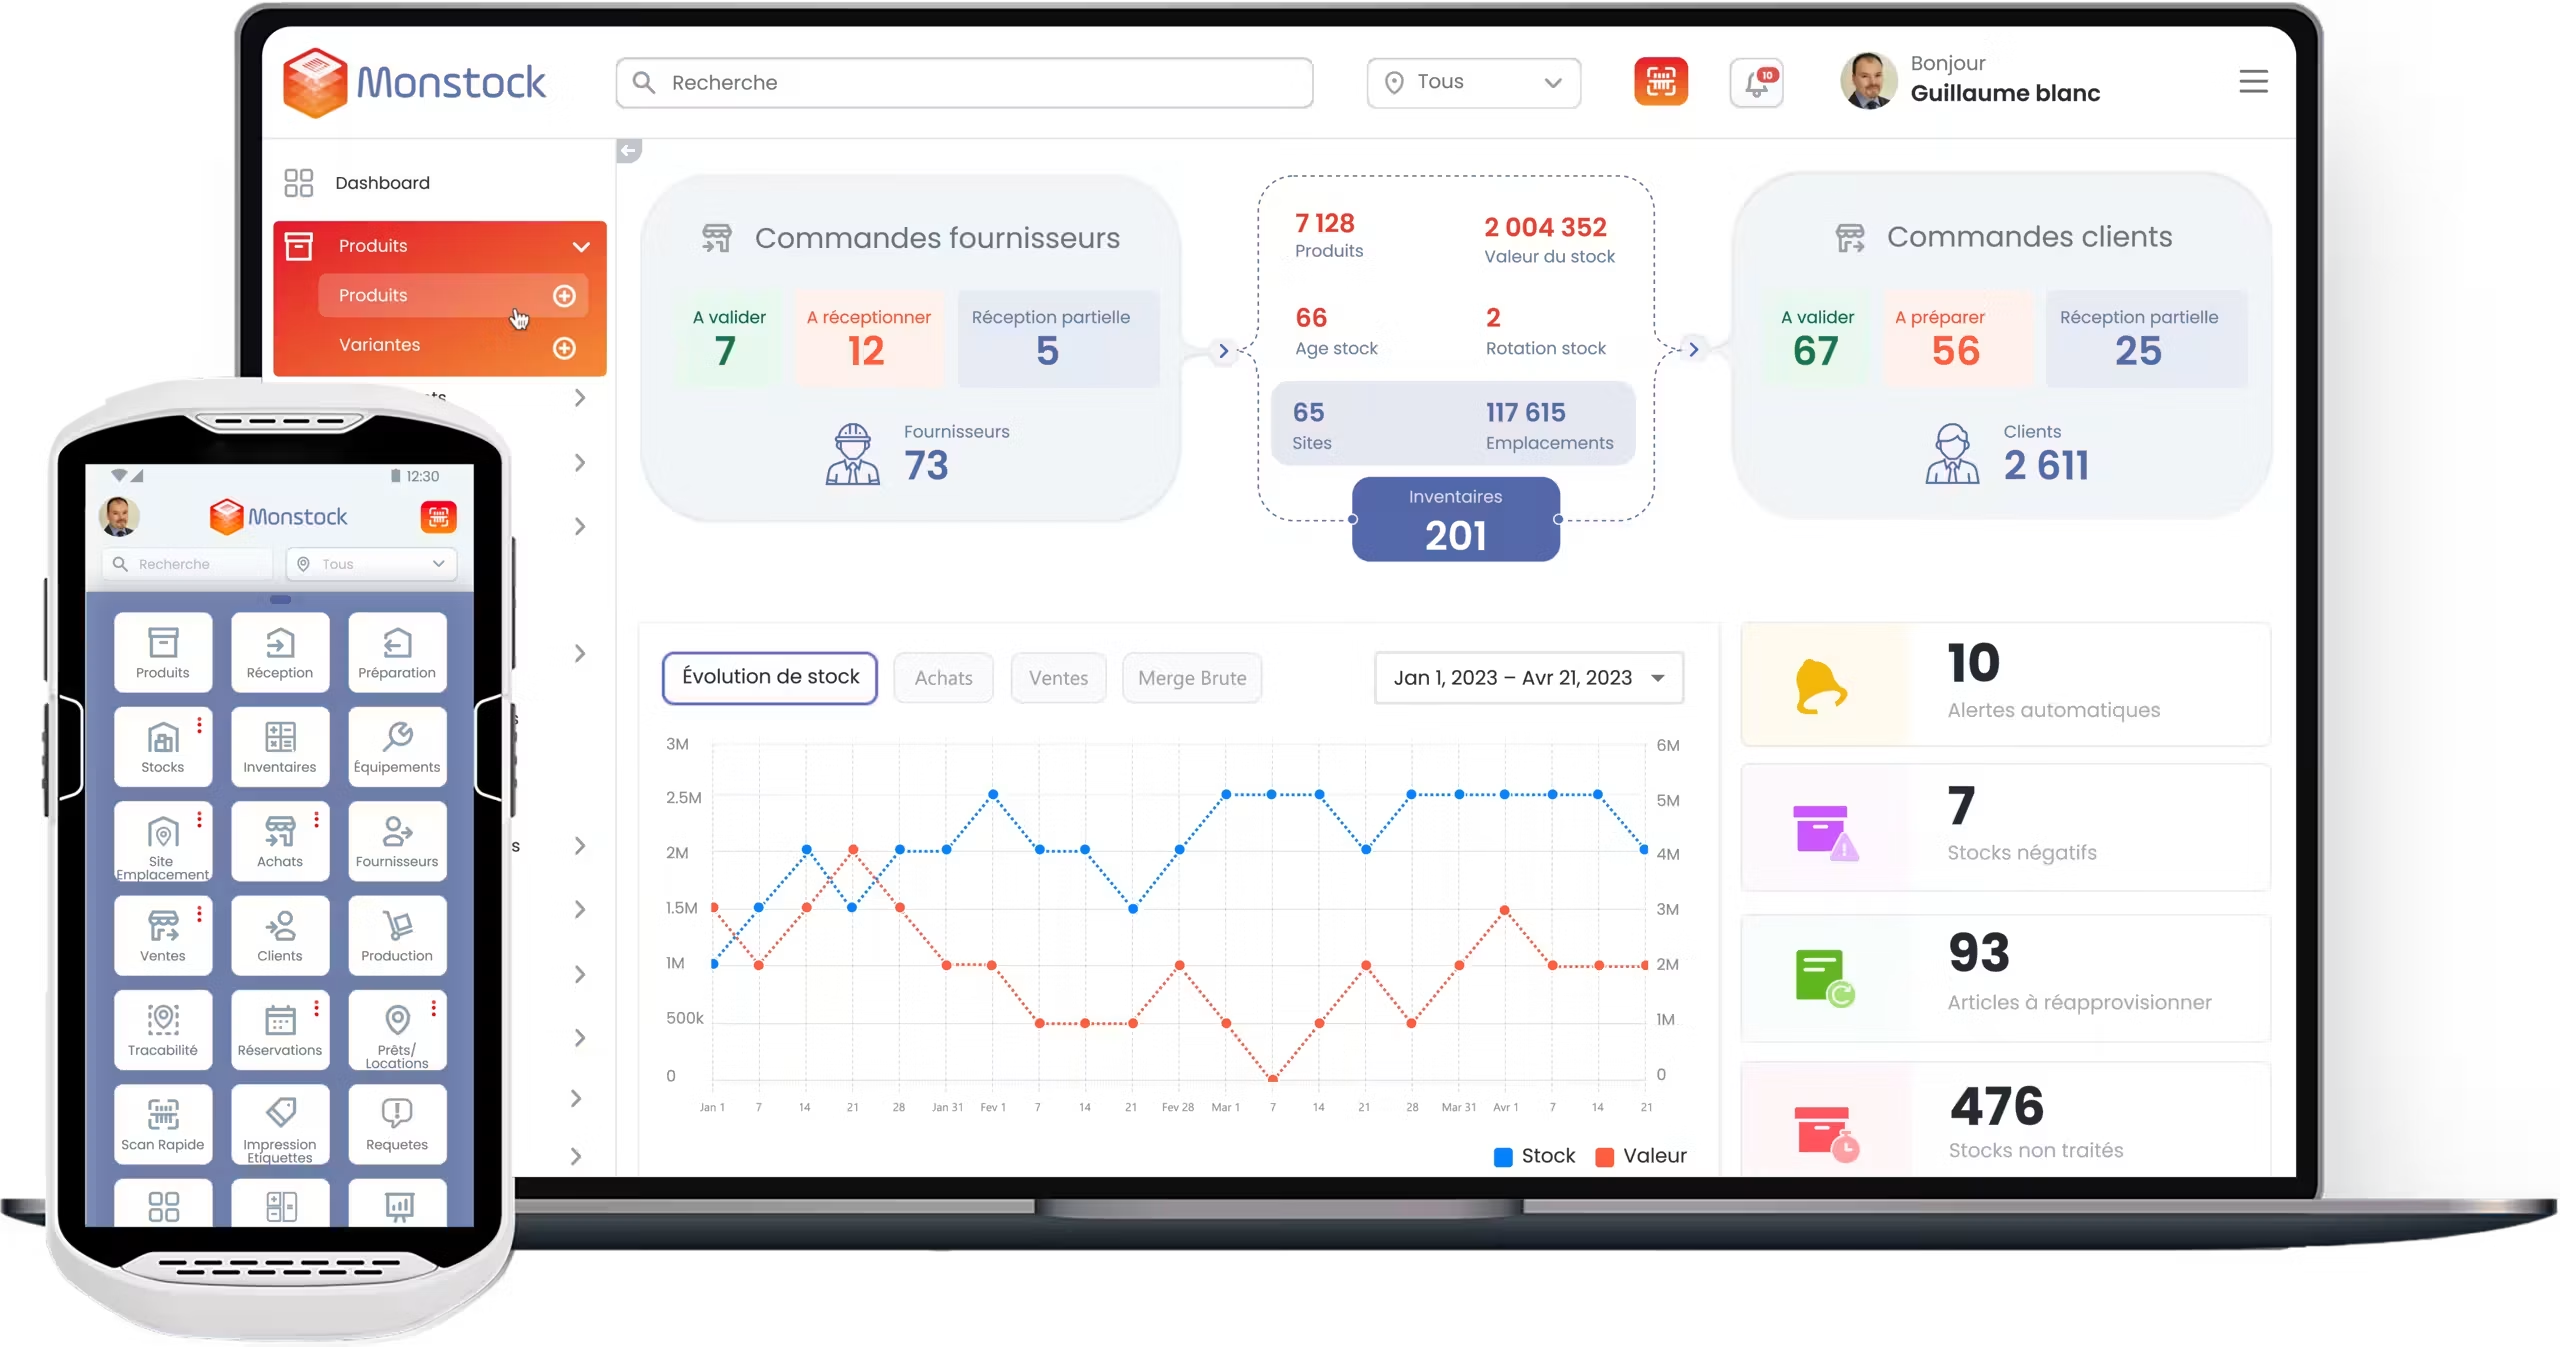
At Monstock, our no-code supply chain management platform centralises your data (stock, sales, deliveries, movements, orders), reduces latency and transforms your KPIs into operational actions thanks to configurable workflows (alerts, restocking, checks, prioritisation).
The result: more agile teams, reliable omnichannel availability and advanced supply chain performance management.
👉 Would you like to identify the most actionable KPIs for your business and integrate them into an operational dashboard? Contact us.
The most important supply chain KPIs depend on the maturity level of the company. Traditional indicators (service rate, inventory turnover, OTIF) remain essential, but they must be supplemented by advanced KPIs focused on anticipation and real time, such as probabilistic forecast accuracy, multi-channel availability, and data latency.
Traditional KPIs mainly analyse past performance. In a highly volatile environment (demand, supplies, costs), they do not allow risks to be anticipated or reactions to be sufficiently rapid. Advanced KPIs provide a predictive and operational reading, which is essential for an agile and resilient supply chain.
A real-time supply chain KPI measures an operational phenomenon with very low latency between the event and its exploitation (a few minutes). It allows immediate action to be taken: adjusting replenishment, correcting omnichannel availability or triggering an automated workflow.
Omnichannel availability is measured by comparing theoretical and actual sellable stock across each channel (store, e-commerce, marketplace, B2B). Key indicators include the percentage of unsellable items, stock discrepancies between systems, and data synchronisation time.
A silent break corresponds to an undetected loss of sales: the product physically exists in stock, but it is not saleable (system blockage, configuration error, unpublished item). This phenomenon generates a significant loss of earnings, which is often invisible in traditional reporting.
Supply chain resilience can be improved by monitoring indicators related to critical suppliers (delivery time variability, service levels during crises, dependency), as well as internal adaptability: process innovation, automation and workflow agility.
No. Thanks to no-code and data-driven platforms, advanced KPIs are now accessible to mid-sized companies and SMEs. The challenge is not the size of the company, but the ability to centralise data, reduce latency and transform indicators into operational actions.
Deployment can be carried out gradually using configurable, no-code tools. These platforms enable the creation of dashboards, alerts and workflows without specific development, while integrating with existing systems (ERP, WMS, OMS).
The most relevant KPIs are those that combine economic performance and environmental impact, such as energy efficiency per logistics unit or CO₂ emissions per order. They enable logistics plans to be balanced while meeting CSR and regulatory requirements.
Monstock helps you turn your stock into a real strategic asset. Thanks to agile and intelligent management, our solution allows you to anticipate risks, secure your supplies and guarantee the continuity of your activities, even in times of uncertainty.
To learn more about strategic inventory management and discover our other use cases, click here.
For further information, please contact the Monstock team.
Sign up for our newsletter today